
Stock charts are one of the most important tools that investors and traders use to make decisions about buying and selling stocks.
The days when you would have to manually collect the price or volume data of your favourite stock and draw them on paper are long gone. Now, investors can view the chart of any stock at the click of a button.
Stock charts provide a visual representation of price action and can be used to identify trends, support and resistance levels, and potential buy and sell signals. They also provide essential insights when making critical investment decisions that may not be readily apparent from simply looking at stock prices.
Today investors get multiple options for stock charting software in Canada, and it can be difficult to know which one is right for you.
Whether you’re a beginner or a seasoned investor, it’s important to find software that meets your needs and budget. Keep reading to know which stock charting tool is the best fit for you.
What is a Stock Charting Software?
Stock charting software is a program or application that allows you to visualize data related to stocks and other securities. This data can include historical prices, volume, and even dividend distributions.
There are many different types of stock charting tools available, and they can vary in terms of features and functionality. Some software programs are designed for specific types of investors, while others are more general in nature.
However, all of them allow you to see a stock’s price movement and the volume of its traded shares during a specific timeframe.
Generally, one can divide stock charting software into two broad groups – free and paid – each with its own advantages and disadvantages.
It is also important to note that most paid stock charting apps come with a free version that offers some basic features or a free trial period. Free software is often more basic and may not have all the features you’re looking for, but it can be a good option if you’re just starting out.
Paid software usually comes with more features. For example, most paid stock charting apps allow you to export data from the software to your device, a feature that most free software programs don’t provide.
Best Free Stock Charting Software in Canada for 2024
1. Google Finance
Most individual investors around the world and in Canada are passive investors who don’t want to actively track each move made by the stocks or ETFs they hold.
If you are a passive investor or someone who has just started learning about investments, perhaps you don’t need a stock charting tool with all the bells and whistles. In that case, Google Finance stock charts can work for you.
What’s more? You don’t need to open a separate application to view free Google stock charts. All you need to do is go to google, type the name of the company or its ticker whose chart you want to view, add the word ‘stock’ to it, and a real-time stock chart of that company will appear (applies to listings on the NYSE and NASDAQ – others may be delayed).
For example, you can go to Google and type “Tesla Stock” or “TSLA Stock,” and a chart like this will appear on top of your search result page:
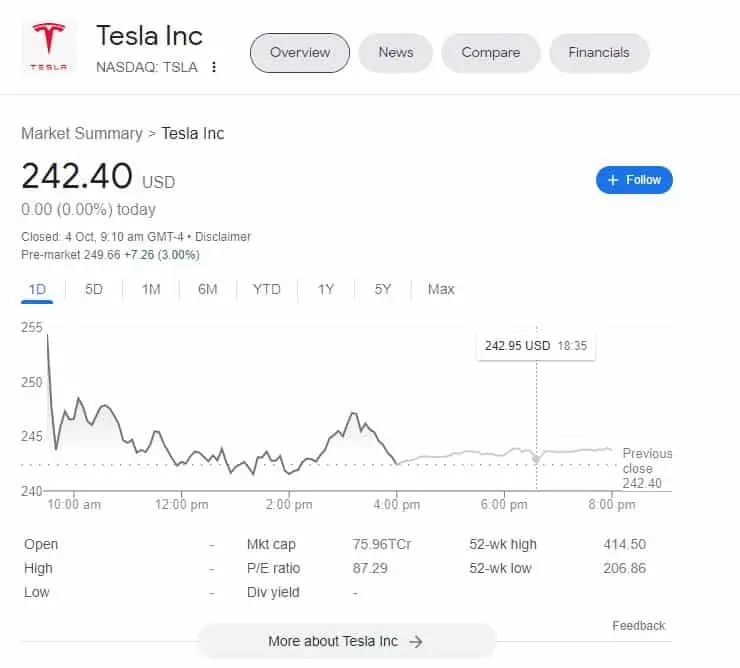
The default setting of this stock chart is one day, so it will show you the real-time price movement of Tesla stock if the markets are live or the previous day’s movements if the markets are closed.
You can also see how the stock has performed in the last five days, one month, six-month, year-to-date and in other timeframes by clicking on the options at the top of the stock chart.
At the bottom of the chart, you get the option ‘More about (Company)’ clicking on, which will lead you to a different page with extra information about the company, like its financial performance and the latest news around the stock.
- You don’t need to visit a separate platform or website or download a stock charting app.
- Simple price chart with historical data.
Cons
- Lacks even basic features and functionalities. A few basic tools and indicators, like moving averages, were removed in an update a few years ago.
- 15-min delay for Canadian assets.
2. Yahoo Finance
If you’re looking for free stock charts online, Yahoo Finance is among the best options available today and has been one for a long time.
One of the many reasons for its continued popularity is its clean interface, which is easy to use and offers a variety of features that can be helpful for both experienced investors and those just starting out.
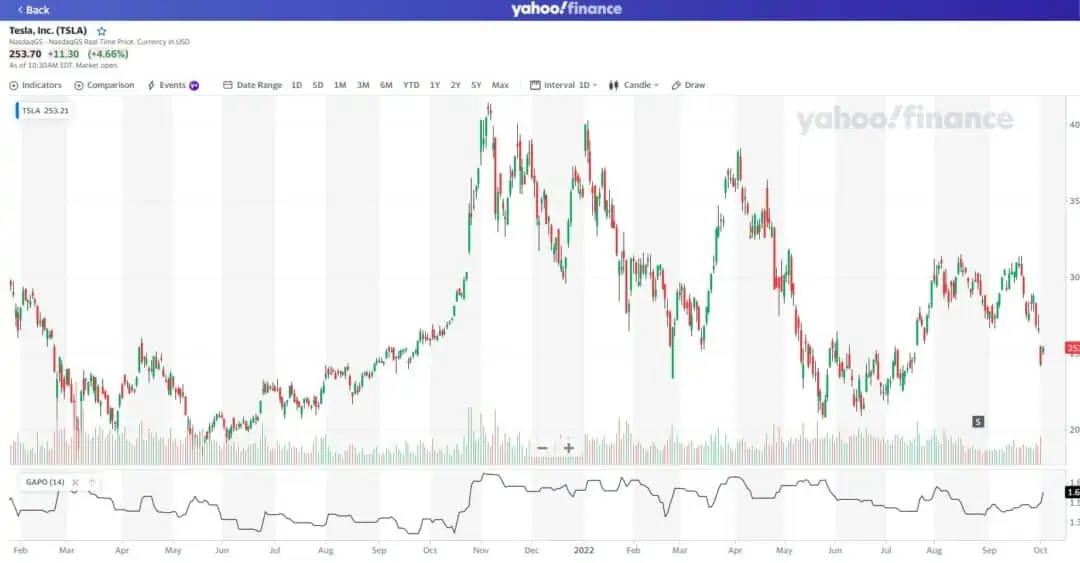
Apart from the ability to view stock prices for a specific period of time, another useful feature offered by Yahoo Finance’s stock charting software is the ability to add technical indicators.
Technical indicators can be used to help you make investment decisions by providing information about a stock’s momentum, volatility, and other factors.
Yahoo Finance offers more than 50 indicators that you can add to your charts, and you can even customize the settings for each indicator to get the information that you want.
Moreover, it also has a comparison feature, which helps you compare the performance of one security or index with others.
That’s not all. You can draw trendlines and support resistance levels on the chart by using the ‘draw’ feature. If you are a seasoned investor or trader who only looks at candlestick charts, Yahoo stock charts has got you covered there too.
You can select the different chart types – line, area, candles, bars, and others- by clicking on the default ‘Line’ option at the top of the page.
- Offers a clean HTML5 interface.
- Access to multiple tools and indicators.
- The minimum time interval you can set and update a candlestick chart is one minute.
- Sharing stock charts with others or on social media is made easy by the ‘share’ feature.
Cons
- Many features, information and insights, and stock-related events like stock splits and dividends are hidden behind a paywall. The subscription for Yahoo Finance Plus starts at $20.83 per month for the ‘Lite’ package and $29.16 for the ‘Essential’ package when billed annually.
3. Stockcharts.com
When it comes to tracking your favourite stocks, few websites can match the simplicity and experience offered by StockCharts.com. For more than two decades, StockCharts has been the prime destination for technical analysis on the web, with millions of unique visitors each month.
Over the years, the platform has added an extensive and ever-growing set of charts and indicators and powerful tools, all available for free to help investors.
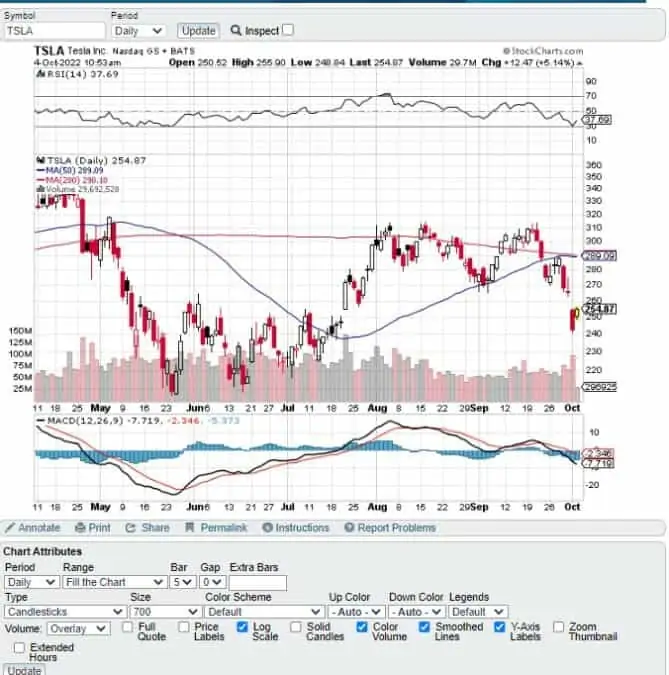
Though StockCharts doesn’t offer HTML5 charting like Yahoo Finance, one of the things that make StockCharts unique is its ability to show you stock charts with indicators that load along with the price chart when you search for a stock.
This allows you to not go through the hassle of adding each indicator separately. Instead, you can just customize the parameters of those indicators according to your preference.
In addition to the charts and tools, the website also offers a wide range of educational resources to help you learn more about technical analysis.
Pros
- Easy to use interface.
- Charts load extremely quickly, which is great if you want to analyze your stocks quickly at a destination with a spotty internet connection.
- Pre-added indicators that save you time.
Cons
- The minimum time interval you can set and update a candlestick chart is one day.
- With no HTML5 charting and real-time updates, the free stock charts might not add much value to traders or active investors.
4. TradingView
We have been saving the best for the last. TradingView emerged as an underdog in the stock charting software space some time ago and has conquered the arena in just a few years.
There are many reasons why TradingView is the best free stock charting app and is used widely not only in Canada but around the world. Apart from almost all the features offered by Yahoo Finance, TradingView stock charts offer many more features that make it an even more powerful tool for traders and investors alike.
So, instead of coming up with a separate list of ‘pros’ of using TradingView. Here are some of the best free features that TradingView offers that distinguish it from competitors:
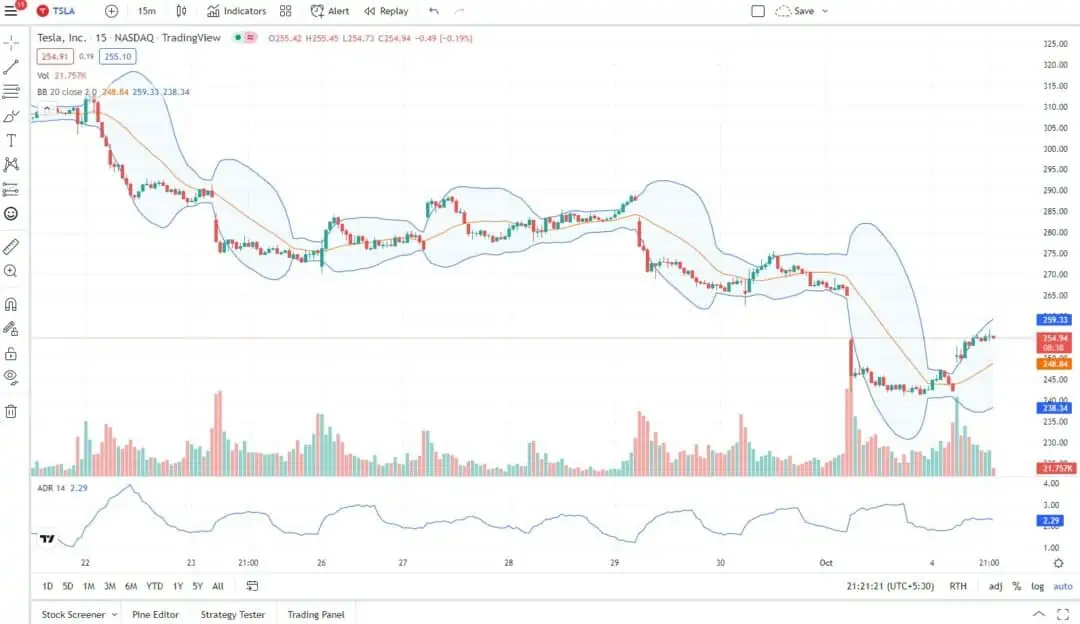
1. Customizable Charts
TradingView offers completely customizable charts. This means that you can tailor the charts to your own trading strategy and preferences. You can add or remove indicators, set alerts, and much more.
It is the only platform that offers advanced charts for free with a wide range of indicators and drawing tools. You can also create custom charts and save them for later use.
2. Professional Grade Tools
TradingView provides sophisticated analysis tools that are usually only available to professional traders. These tools can help you make better trading decisions and improve your results.
3. Social Trading
TradingView’s social trading features allow you to follow other traders, see their charts and analysis, and copy their trades. This is a great way to learn from more experienced traders and also get new ideas for your own trading.
4. Real-time Data
TradingView provides free real-time crock charts and data for over 100,000 financial instruments, much more than any competitor. The list is endless and includes almost all stocks, futures contracts, forex pairs, and cryptocurrencies.
5. Backtesting
TradingView’s backtesting feature lets you test your trading strategies on historical data. This is a valuable tool for perfecting your strategy before you put it into practice.
The best thing about TradingView is that most of its features are completely free to use. There’s no need to sign up for a premium account – you can access all the features of the platform without spending a dime.
Cons
- None that we can point out.
What to Look For When Choosing a Charting Software?
When it comes to choosing stock charting software, there are a few things you need to take into account.
Here are a few tips to help you choose the best stock charting tool for your needs.
Define your needs: Before you start looking for stock charting software, you need to know what you need it for.
Are you looking for software that can help you with your investment decisions? Or are you simply looking for software that can give you an overview of the market?
Knowing what you need the software for will help you narrow down your choices.
Consider your budget: There are a lot of different stock charting software programs out there, some free, some paid, and some come with different price tags. If you have a limited budget, then you need to be careful about which software you choose.
Some of the more expensive software programs may have features that you don’t need, so don’t get caught up in the price tag.
Do your research: Once you know what you need and how much you’re willing to spend, you can start doing your research. There are a lot of different software programs out there, so take your time to read reviews like ours and compare features.
Test it out: Once you’ve narrowed down your choices, it’s time to test out the software. Most stock charting apps offer free trials, so take advantage of that.
Test out the software to see how easy it is to use and whether it has the features you need.
Top Stock Charting Software (Paid/Subscription)
- Bloomberg Terminal
- Refinitiv Eikon
- TradingView Premium
- TD Ameritrade’s thinkorswim
- MetaStock
- Power E*TRADE
- eSignal
Bottomline
There are different types of investors and traders, and each has different needs when it comes to stock charting software. Some need complex software with all the bells and whistles, while others just need something simple to get the job done. And then there are those who need something in between.
We don’t think paid charting software is not suitable for everyone. Some people might be perfectly happy with the free stock charts website and charting software they find online, while others need the more advanced features that come with a paid subscription.
If you are an absolute beginner to investing or someone who doesn’t actively trade or invest, the charts on Google Finance might be enough for you.
For traders and investors with some experience, Yahoo Finance, StockCharts or the free version of TradingView might suffice.
For seasoned investment professionals, even a paid subscription to the best web-based charting software might not be enough. They might want a Bloomberg terminal. Ultimately, it all depends on your needs as an investor or trader.
Best Free Stock Charting Software FAQs
There are a few different types of graphs that can be useful for stock market analysis. Some common ones are line graphs, bar graphs, and candlestick charts. Each has its own strengths and weaknesses. Line graphs are perhaps the simplest type of graph, and they can be used to track various data points over time. They’re especially useful for beginners and people who rarely track their portfolios actively. Bar graphs are a bit more complex and can be used to compare multiple data points side-by-side but require some skills. Candlestick charts are the most complex of the three, but they can provide a wealth of information at a glance.
It depends on where you are in your investing or trading journey. However, overall, in our opinion, TradingView is the best free stock charting tool available today and beats the competition hands down with its multiple features and tools.
Unless you are an old-school chartist, investor or trader, there is no doubt here. TradingView beats StockCharts by a wide margin in features and functionalities. StockCharts might load quickly, but that won’t be helpful for you unless you are at a remote location.
Related posts:


“All you need to do is go to google, type the name of the company or its ticker whose chart you want to view, add the word ‘stock’ to it, and a real-time stock chart of that company will appear.”
This is not true of Canadian stocks/ETFs/REITs. Google has a 15 minute delay for everything not traded on NASDAQ or NYSE.
@Ryan: You are correct – I updated with that detail.
When it comes to free stock charting, Webull is the best I have seen and used for a number of years. Webull also has a desktop app which is great for a computer screen/monitor (Large charts). I also use Webull for monitoring, not trading.
Unfortunately, I received an announcement from Webull saying that they will not be receiving Toronto stock feeds after Feb.28/2023 – sad.
I have tried Tradingview and the only con I see is that for the basic service, they only allow one price alert for all your stocks.
I am presently using today Investing.com, and still looking for a better App close to Webull.